| Dog | N | Average | Std. Dev. | 25% | 50% | 75% | Min | Max |
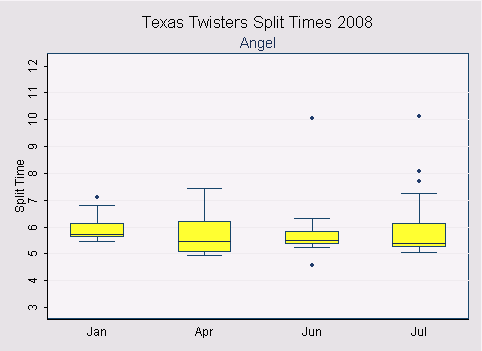
| ANGEL | 92 | 5.81 | 0.90 | 5.32 | 5.53 | 6.09 | 4.57 | 10.12 |
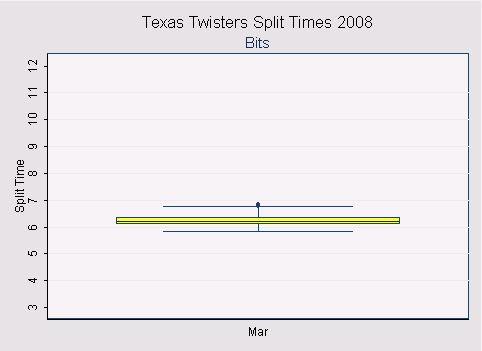
| BITS | 35 | 6.24 | 0.25 | 6.10 | 6.22 | 6.36 | 5.82 | 6.85 |
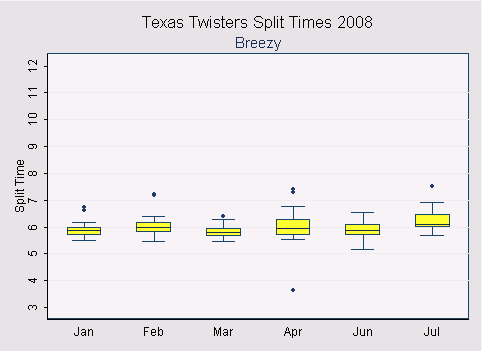
| BREEZY | 197 | 5.97 | 0.42 | 5.70 | 5.93 | 6.12 | 3.64 | 7.50 |
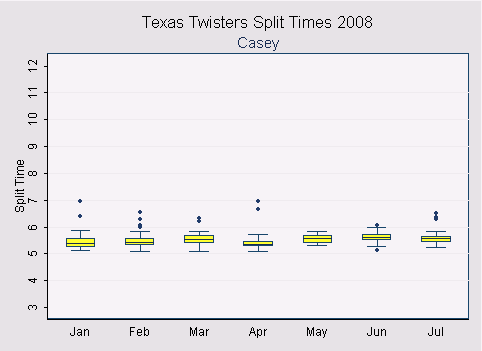
| CASEY | 204 | 5.54 | 0.32 | 5.33 | 5.49 | 5.65 | 5.07 | 6.96 |
| 186 | 4.77 | 0.43 | 4.49 | 4.68 | 4.87 | 3.61 | 6.88 | |
| GRACIE | 154 |
5.78 | 0.36 | 5.55 | 5.70 | 5.94 | 5.13 | 7.67 |
| JACK | 150 | 6.76 | 0.54 | 6.37 | 6.71 | 7.06 | 5.24 | 8.86 |
| JAZZMYN | 2 | 8.65 | 0.13 | 8.56 | 8.65 | 8.74 | 8.56 | 8.74 |
| KATIE | 222 | 5.04 | 0.54 | 4.70 | 4.90 | 5.18 | 4.43 | 9.66 |
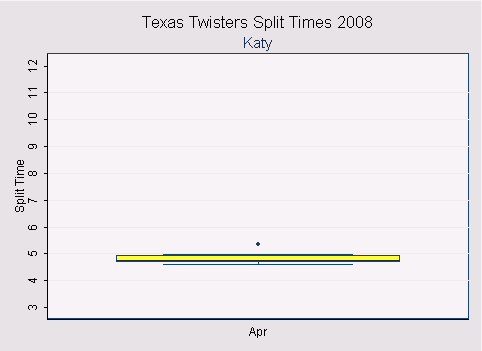
| KATY | 19 | 4.80 | 0.18 | 4.66 | 4.75 | 4.93 | 4.60 | 5.36 |
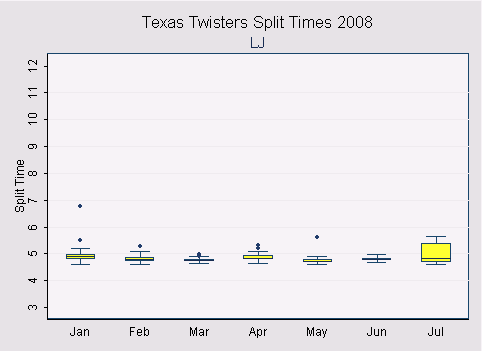
| LJ | 199 | 4.84 | 0.21 | 4.73 | 4.80 | 4.90 | 4.59 | 6.78 |
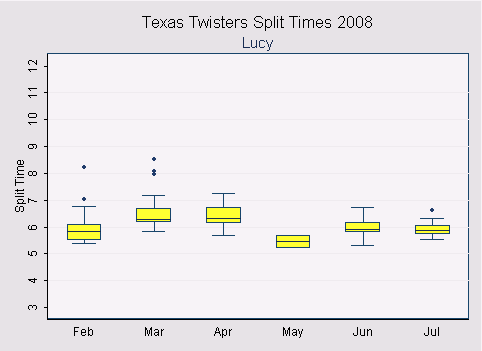
| LUCY | 150 | 6.15 | 0.53 | 5.81 | 6.06 | 6.33 | 5.19 | 8.51 |
| MAX | 3 | 4.97 | 0.25 | 4.81 | 4.84 | 5.25 | 4.81 | 5.25 |
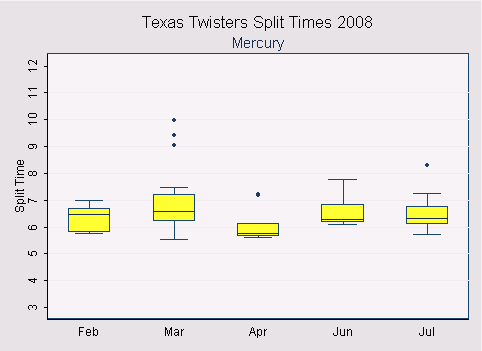
| MERCURY | 76 | 6.55 | 0.83 | 6.03 | 6.33 | 7.01 | 5.53 | 9.95 |
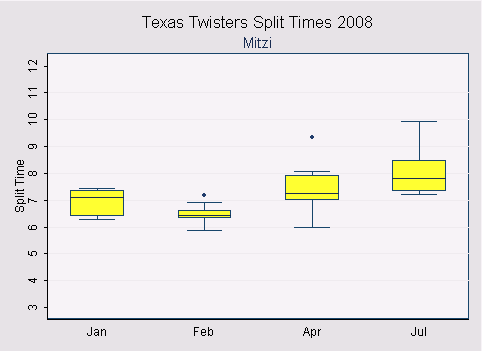
| MITZI | 46 | 7.10 | 0.90 | 6.43 | 7.01 | 7.54 | 5.86 | 9.93 |
| 67 | 5.21 | 0.36 | 4.98 | 5.16 | 5.41 | 4.66 | 6.25 | |
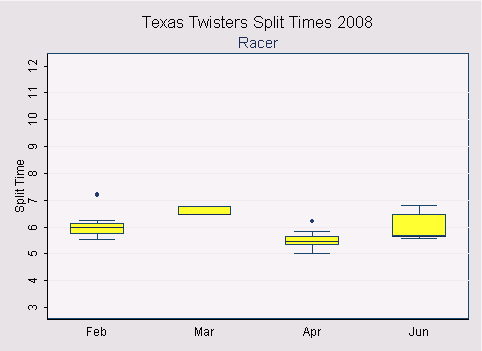
| RACER | 40 | 5.95 | 0.49 | 5.62 | 5.86 | 6.20 | 5.02 | 7.20 |
| RUDY T | 5 | 7.37 | 0.16 | 7.25 | 7.38 | 7.50 | 7.18 | 7.57 |
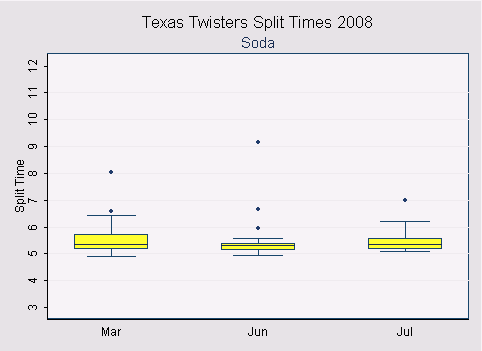
| SODA | 82 | 5.50 | 0.64 | 5.14 | 5.31 | 5.56 | 4.91 | 9.16 |
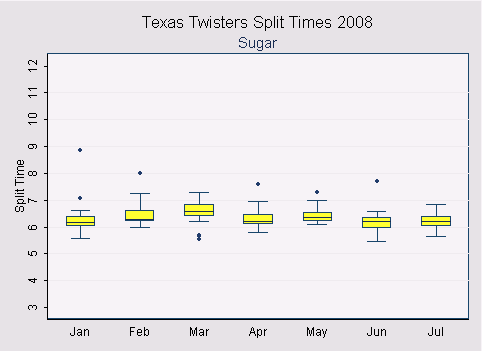
| SUGAR | 223 | 6.32 | 0.41 | 6.09 | 6.28 | 6.48 | 5.47 | 8.85 |
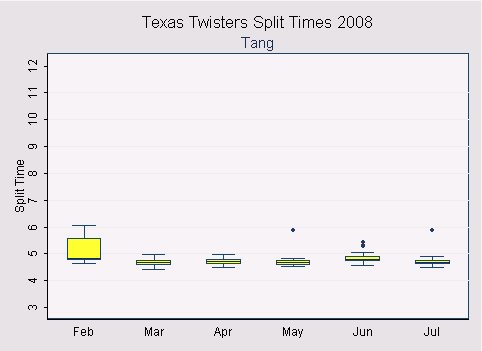
| TANG | 184 | 4.75 | 0.25 | 4.62 | 4.71 | 4.80 | 4.44 | 6.07 |
N = The number of times your dog ran
Average = The sum of all of your dog's splits divided by the total number of times your dog ran (N)
Std. Dev. = The variation associated with the average.
A good way to read your dog's average time is to say, "On average, Angel ran in 5.81 seconds plus or minus 0.9 seconds." Or, you could say, "Angel ran, on average, between 4.91 seconds and 6.71 seconds."
The smaller the standard deviation, the more consistent your dog runs.
From this, you might conclude that Angel's not very predictable. :)
LJ is the most consistent. Her times vary only by 0.21 seconds on average.
The standard deviation really is only meaningful if your dog has run 30 or more times this year.
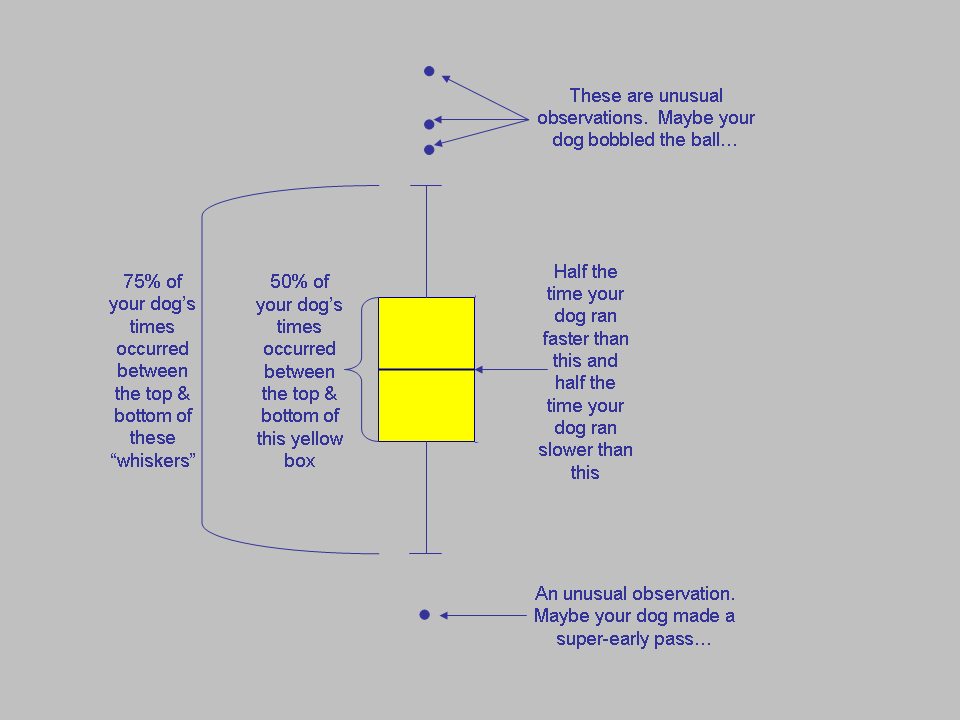
25%, 50%, 75% = To be explained later...Read on...
Min = The fastest time your dog ran. Note that this could be due to an early pass. If your "real" fastest time is not displayed it's probably because nobody wrote down at the tournament.
Max = The slowest time your dog ran. It could be because of a dropped ball or bobble, etc.
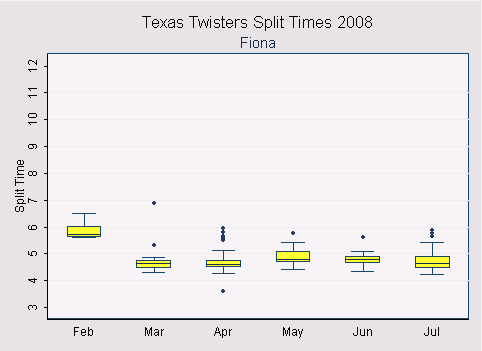
Boxplots can tell you alot about your tournament.
For example, look at Tang's plots. In February, her yellow box is kind of big indicating that Tang's times had a relatively wide range. Maybe it was Tang's first tournament and the dog was not in the zone and Mac was figuring out passing. But, as you look at other tournaments, the yellow box and "whiskers" really small probably because Tang and Mac are really consistent.
Now, look at LJ's box plot. LJ has been running with Mac for a long, long, long long time and it shows. Every tournament is very similar. The dots you see are called "outliers" and it means that the LJ ran slower than usual. It could be a bobble or something. Notice that LJ boxplot for July is pretty different than the others. This bigger box, with wider "whiskers," indicates that LJ had more variation in his times than in previous tournaments.
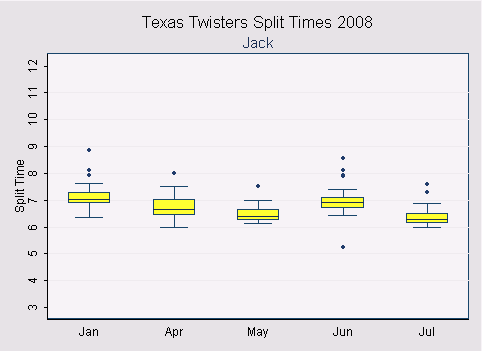
Check out Jack's boxlplot for June. Notice he has a dot (called an "outlier") below the yellow box. Did he really run in less than 5.5 seconds? Notice his average time was between 6.2 seconds and 7.3 seconds.